DDD is the Data Display Debugger, and is a nice GUI front-end to gdb, the GNU debugger. For a long time, the authors believed that the only thing you really needed to debug was gdb at the command line. However, when reverse engineering, the ability to keep multiple windows open with stack contents, register values, and disassembly all on the same workspace is just too valuable to pass up.
Also, DDD provides you with a gdb command line window, and so you really aren't missing anything by using it. Knowing gdb commands is useful for doing things that the UI is too clumsy to do quickly. gdb has a nice built-in help system organized by topic. Typing help will show you the categories. Also, DDD will update the gdb window with commands that you select from the GUI, enabling you to use the GUI to help you learn the gdb command line. The main commands we will be interested in are run, break, cont, stepi, nexti, finish, disassemble, bt, info [registers/frame], and x. Every command in gdb can be followed by a number N, which means repeat N times. For example, stepi 1000 will step over 1000 assembly instructions.
A breakpoint stops execution at a particular location. Breakpoints are set with the break command, which can take a function name, a filename:line_number, or *0xaddress. For example, to set a breakpoint at the aforementioned __libc_start_main(), simply specify break __libc_start_main. In fact, gdb even has tab completion, which will allow you to tab through all the symbols that start with a particular string (which, if you are dealing with a production binary, sadly won't be many).
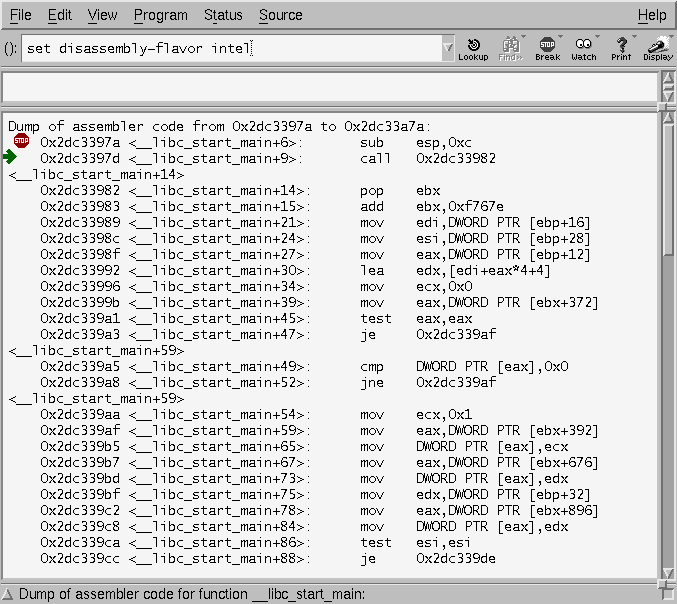
Ok, so now that we've got a breakpoint set somewhere, (let's say __libc_start_main). To view the assembly in DDD, go to the View menu and select source window. As soon as we enter a function, the disassembly will be shown in the bottom half of the source window. To change the syntax to the more familar Intel variety, go to Edit->Gdb Settings... under Disassembly flavor. This can also be accomplished with set disassembly-flavor intel from the gdb prompt. But using the DDD menus will save your settings for future sessions.
Viewing Memory and the Stack
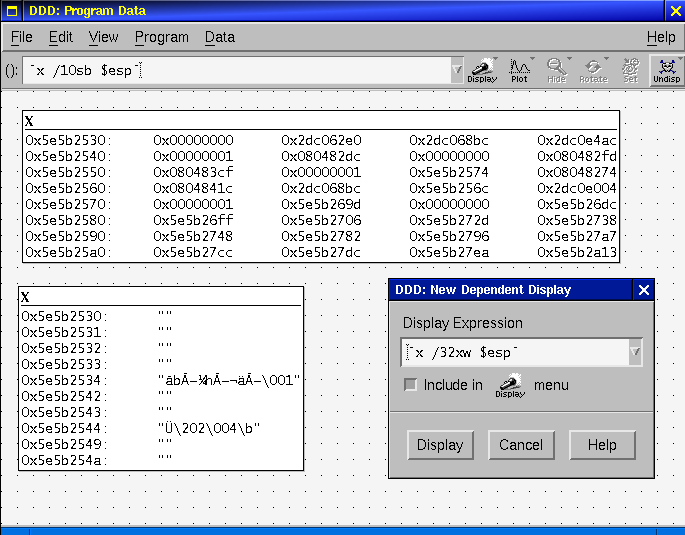
In gdb, we can easily view the stack by using the x command. x stands for Examine Memory, and takes the syntax x /<Number><format letter><size letter> <ADDRESS>. Format letters are (octal), x(hex), d(decimal), u(unsigned decimal), t(binary), f(float), a(address), i(instruction), c(char) and s(string). Size letters are b(byte), h(halfword), w(word), g(giant, 8 bytes). For example, x /32xw 0x400000 will dump 32 words (32 bit integers) starting at 0x400000. Note that you can also use registers in place of the address, if you prefix them with a $. For example, x /32xw $esp will view the top 32 words on the stack.
DDD has some nice capabilities for viewing arbitrary dumps of memory relating to the registers. Go to View->Data Window... Once the Data Window is open, go to Display (hold down the mouse button as you click), and go to Other.. You can type in any symbol, variable, expression, or gdb command (in backticks) in this window, and it will be updated every time you issue a command to the debugger. A couple good ones to do would be `x /32xw $esp` and `x/16sb $esp. Click the little radio button to add these to the menu, and you can then open the stack from this display and it will be updated in real time as you step through your program.
Viewing Memory as Specific Data Structures
So DDD has fantastic ability to lay out data structures graphically, also trough the Display window mentioned above. Simply cast a memory address to a pointer of a particular type, and DDD will plot the structure in its graph window. If the data structure contains any pointers, you can click on these and DDD will open up a display for that structure as well.
Oftentimes, programs we're interested in won't have any debugging symbols, and as such, we won't be able to view any structures in an easy to understand form. For seldom used structures, this isn't that big of a deal, as you can just take them apart using the x command. However, if you are dealing with more complicated data structures, you may want to have a set of types available to use again and again. Luckily, through the magic of the ELF format, this is relatively easy to achieve. Simply define whatever structures or classes you suspect are used and include whatever headers you require in a .c file, and then compile it with gcc -shared. This will produce a .so file. Then, from within gdb but before you begin debugging, run the command set env LD_PRELOAD=file.so. From then on, you will be able to use these types in that gdb/DDD session as if they were compiled in to the program itself. (FIXME: Come up with a good example for this).
-> Example using gdb to set breakpoints in functions with and without debugging symbols.
-> FIXME: Test watchpoints
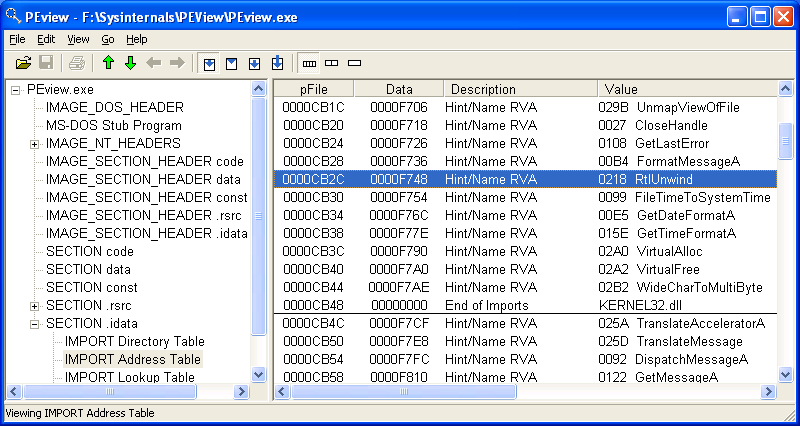
WinDbg is part of the standart Debugging Tools for Microsoft Windows© that everyone can download for free from. Microsoft© offers few different debuggers, which use common commands for most operations and ofcourse there are cases where they differ. Since WinDbg is a GUI program, all operations are supposed to be done using the provided visual components. There is also a command line embeded in the debugger, which lets you type commands just like if you were to use a console debugger like ntsd. The following section briefly mentions what commands are used to do common everyday tasks. For more complete documentation check the Help file that comes with WinDbg. An example debugging session is presented to help clarify the usage of the most common commands.
Breakpoints can be set, unset, or listed with the GUI by using -> or the shortcut keys Alt+F9. From the command line one can set breakpoints using the bp command, list them using bl command, and delete them using bc command. One can set breakpoints both on function names (provided the symbol files are available) or on a memory address. Also if source file is available the debugger will let you set breakpoints on specific lines using the format bX `filename:linenumber`
In WinDbg you can use -> option to open a window which will show you the disassembly of the current context. In ntsd you can use the u to view the disassembled code.
There are couple of things one usually does with the stack. One is to view the frames on the stack, so it can be determined which function called which one and what is the current context. This is done using the k command and its variations. The other common operation is to view the elements on the stack that are part of the current stack frame. The easiest way to do so is using db esp ebp, but it has its limitations. It assumes that the %ebp register actually points to the begining of the stack frame. This is not always true, since omission of the frame pointer is common optimization technique. If this is the case, you can always see what the %esp register is pointing to and start examining memory from that address.
The debugger also allows you to "walk" the stack. You can move to any stack frame using .frame X where X is the number of the frame. You can easily get the frame numbers using kn. Keep in mind that the frames are counted starting from 0 at the frame on top of the stack.
Reading and Writing to Memory
Reading memory is accomplished with the d* commands. Depending on how you want to view the data you use a specific variation of this command. For example to see the address to which a pointer is pointing, we can use dp or to view the value of a word, one can use dw. The help file says that one can view memory using ranges, but one can also use lengths to make it easy to display memory. For example if we want to see 0x10 bytes at memory location 0x77f75a58 you can either say db 77f75a58 77f75a58+10 or less typing gives you db 77f75a58 l 10.
Provided that you have symbols/source files, the dt is very helpful. It tries to find the data type of the sybol or memory location and display it accordingly.
Knowing your debugger can save you lots of time and pain in debugging either your own programs or when reverse engineering other's. Here are few things we find useful and time saving. This is not a complete list at all. If you know other tricks and want to contribute, let us know.
poi() - this command dereferences a pointer to give you the value that it is pointing to. Using this with user-defined aliases gives you convinient way of viewing data.
FIXME: include better example
Let's set a breakpoint in on the function main
0:000> bp main
*** WARNING: Unable to verify checksum for test.exe

Let's set a breakpoint in on the function main
0:000> g
Breakpoint 0 hit
eax=003212e8 ebx=7ffdf000 ecx=00000001 edx=7ffe0304 esi=00000a28 edi=00000000
eip=00401010 esp=0012fee8 ebp=0012ffc0 iopl=0         nv up ei pl zr na po nc
cs=001b  ss=0023  ds=0023  es=0023  fs=0038  gs=0000             efl=00000246
test!main:
00401010 55               push    ebp

Enable loading of line information if available
0:000> .lines
*** ERROR: Symbol file could not be found.  Defaulted to export symbols for ntdll.dll -
Line number information will be loaded

Set the stepping to be by source lines
0:000> l+t
Source options are 1:
     1/t - Step/trace by source line

Enable displaying of source line
0:000> l+s
Source options are 5:
     1/t - Step/trace by source line
     4/s - List source code at prompt

Start stepping through the program
0:000> p
*** WARNING: Unable to verify checksum for test.exe
eax=003212e8 ebx=7ffdf000 ecx=00000001 edx=7ffe0304 esi=00000a28 edi=00000000
eip=00401016 esp=0012fed4 ebp=0012fee4 iopl=0         nv up ei pl nz na po nc
cs=001b  ss=0023  ds=0023  es=0023  fs=0038  gs=0000             efl=00000206
>    6:   char array [] = { 'r', 'e', 'v', 'e', 'n', 'g' };
test!main+6:
00401016 c645f072         mov    byte ptr [ebp-0x10],0x72 ss:0023:0012fed4=05
0:000>
eax=003212e8 ebx=7ffdf000 ecx=00000001 edx=7ffe0304 esi=00000a28 edi=00000000
eip=0040102e esp=0012fed4 ebp=0012fee4 iopl=0         nv up ei pl nz na po nc
cs=001b  ss=0023  ds=0023  es=0023  fs=0038  gs=0000             efl=00000206
>    7:   int intval = 123456;
test!main+1e:
0040102e c745fc40e20100 mov dword ptr [ebp-0x4],0x1e240 ss:0023:0012fee0=0012ffc0
0:000>
eax=003212e8 ebx=7ffdf000 ecx=00000001 edx=7ffe0304 esi=00000a28 edi=00000000
eip=00401035 esp=0012fed4 ebp=0012fee4 iopl=0         nv up ei pl nz na po nc
cs=001b  ss=0023  ds=0023  es=0023  fs=0038  gs=0000             efl=00000206
>    9:   test = (char*) malloc(strlen("Test")+1);
test!main+25:
00401035 6840cb4000       push    0x40cb40
0:000>
eax=00321018 ebx=7ffdf000 ecx=00000000 edx=00000005 esi=00000a28 edi=00000000
eip=00401051 esp=0012fed4 ebp=0012fee4 iopl=0         nv up ei pl nz na po nc
cs=001b  ss=0023  ds=0023  es=0023  fs=0038  gs=0000             efl=00000206
>   10:   if (test == NULL) {
test!main+41:
00401051 837df800       cmp dword ptr [ebp-0x8],0x0 ss:0023:0012fedc=00321018
0:000>
eax=00321018 ebx=7ffdf000 ecx=00000000 edx=00000005 esi=00000a28 edi=00000000
eip=00401061 esp=0012fed4 ebp=0012fee4 iopl=0         nv up ei pl nz na po nc
cs=001b  ss=0023  ds=0023  es=0023  fs=0038  gs=0000             efl=00000206
>   13:   strncpy(test, "Test", strlen("Test"));
test!main+51:
00401061 6848cb4000       push    0x40cb48
0:000>
eax=00321018 ebx=7ffdf000 ecx=00000000 edx=74736554 esi=00000a28 edi=00000000
eip=00401080 esp=0012fed4 ebp=0012fee4 iopl=0         nv up ei pl nz ac po nc
cs=001b  ss=0023  ds=0023  es=0023  fs=0038  gs=0000             efl=00000216
>   14:   test[4] = 0x00;
test!main+70:
00401080 8b4df8           mov     ecx,[ebp-0x8]     ss:0023:0012fedc=00321018
0:000>
eax=00321018 ebx=7ffdf000 ecx=00321018 edx=74736554 esi=00000a28 edi=00000000
eip=00401087 esp=0012fed4 ebp=0012fee4 iopl=0         nv up ei pl nz ac po nc
cs=001b  ss=0023  ds=0023  es=0023  fs=0038  gs=0000             efl=00000216
>   16:   printf("Hello RevEng-er, this is %s\n", test);
test!main+77:
00401087 8b55f8           mov     edx,[ebp-0x8]     ss:0023:0012fedc=00321018

Display the array as bytes and ascii
0:000> db array array+5
0012fed4  72 65 76 65 6e 67                                reveng

View the type and value of intval
0:000> dt intval
Local var @ 0x12fee0 Type int
123456

View the type and value of test
0:000> dt test
Local var @ 0x12fedc Type char*
0x00321018 "Test"

View the memory test points to manually
0:000> db 00321018 00321018+4
00321018  54 65 73 74 00                                   Test.

Quit the debugger
0:000> q
quit:
Unloading dbghelp extension DLL
Unloading exts extension DLL
Unloading ntsdexts extension DLL
|